
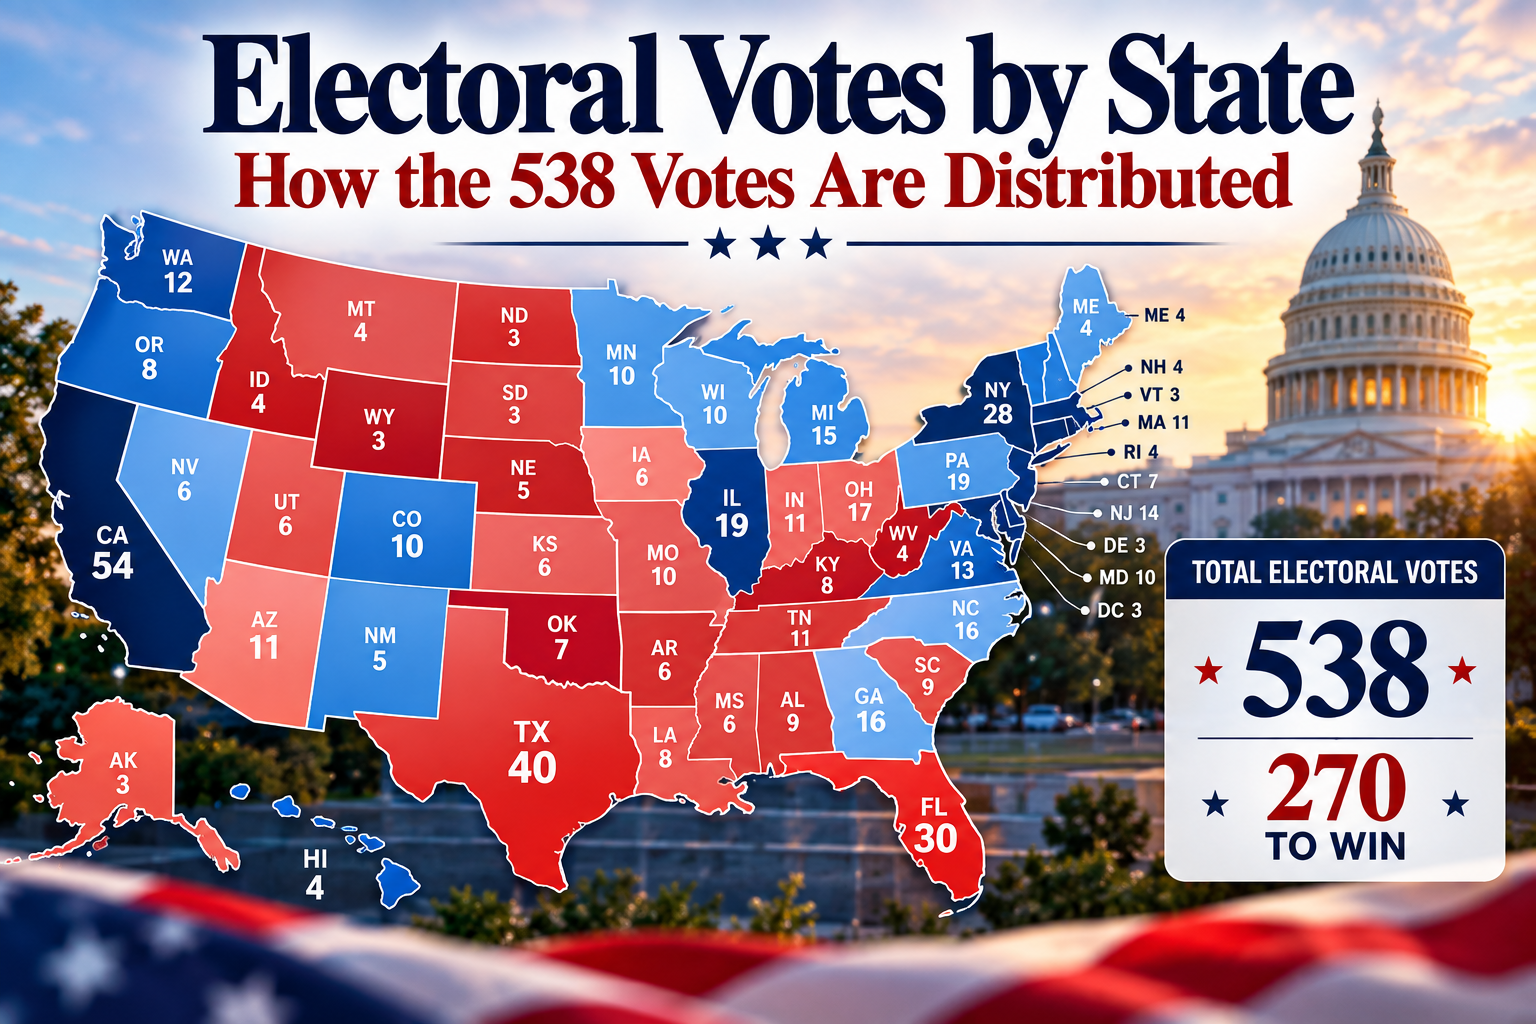
Every four years, the presidential election is decided through 538 electoral votes distributed among the 50 states and the District of Columbia. A candidate normally needs a majority—270 electoral votes—to be elected president.
The number assigned to each state is based on its representation in Congress: one electoral vote for each U.S. representative plus two for its senators. The District of Columbia receives three electoral votes under the Twenty-third Amendment.
The current distribution is based on the 2020 Census and applies to the 2024 and 2028 presidential elections.
Electoral Votes by State: Complete 2024/2028 Table
For each state:
Electoral votes = U.S. House seats + 2 U.S. senators
The District of Columbia is the exception because it is not a state and has neither senators nor a voting House member. Its three electoral votes come from the Twenty-third Amendment.
| State / District | House Seats | Electoral Votes |
|---|---|---|
| Alabama | 7 | 9 |
| Alaska | 1 | 3 |
| Arizona | 9 | 11 |
| Arkansas | 4 | 6 |
| California | 52 | 54 |
| Colorado | 8 | 10 |
| Connecticut | 5 | 7 |
| Delaware | 1 | 3 |
| District of Columbia* | — | 3 |
| Florida | 28 | 30 |
| Georgia | 14 | 16 |
| Hawaii | 2 | 4 |
| Idaho | 2 | 4 |
| Illinois | 17 | 19 |
| Indiana | 9 | 11 |
| Iowa | 4 | 6 |
| Kansas | 4 | 6 |
| Kentucky | 6 | 8 |
| Louisiana | 6 | 8 |
| Maine | 2 | 4 |
| Maryland | 8 | 10 |
| Massachusetts | 9 | 11 |
| Michigan | 13 | 15 |
| Minnesota | 8 | 10 |
| Mississippi | 4 | 6 |
| Missouri | 8 | 10 |
| Montana | 2 | 4 |
| Nebraska | 3 | 5 |
| Nevada | 4 | 6 |
| New Hampshire | 2 | 4 |
| New Jersey | 12 | 14 |
| New Mexico | 3 | 5 |
| New York | 26 | 28 |
| North Carolina | 14 | 16 |
| North Dakota | 1 | 3 |
| Ohio | 15 | 17 |
| Oklahoma | 5 | 7 |
| Oregon | 6 | 8 |
| Pennsylvania | 17 | 19 |
| Rhode Island | 2 | 4 |
| South Carolina | 7 | 9 |
| South Dakota | 1 | 3 |
| Tennessee | 9 | 11 |
| Texas | 38 | 40 |
| Utah | 4 | 6 |
| Vermont | 1 | 3 |
| Virginia | 11 | 13 |
| Washington | 10 | 12 |
| West Virginia | 2 | 4 |
| Wisconsin | 8 | 10 |
| Wyoming | 1 | 3 |
| Total | 435 | 538 |
The District of Columbia has three electoral votes under the Twenty-third Amendment. It has no U.S. senators or voting House member, so the state formula does not apply.
Last verified: September 2026.
I independently compared the table against the National Archives allocation and the Census Bureau’s state-by-state 2020 apportionment data.
Why Are There 538 Electoral Votes?
The total comes from three components:
435 House-based votes + 100 Senate-based votes + 3 for the District of Columbia = 538 electoral votes.
Each state receives as many electors as it has members in its congressional delegation. The District of Columbia receives three under the Twenty-third Amendment. With 538 electors, the normal majority required to elect a president is 270.
The Constitution does not itself set the House at 435 voting members. The size and apportionment of the House are governed by federal law. The Census Bureau currently distributes 435 House seats among the 50 states after each decennial census.
For a broader explanation of what happens after voters cast their ballots, see How U.S. Presidential Elections Work: A Step-by-Step Guide.
How Electoral Votes Are Calculated
For a state, the calculation is straightforward:
Electoral votes = House seats + 2
The additional two correspond to the state’s two U.S. senators.
For example, Texas has 38 House seats and therefore 40 electoral votes. California has 52 House seats and 54 electoral votes. Wyoming has one House seat and 3 electoral votes.
The Senate component stays at two for every state. What changes after a census is the House component.
The Census Bureau distributes the 435 House seats among the states using the method of equal proportions, with every state guaranteed at least one House seat.
That process is called apportionment.
Which States Have the Most Electoral Votes?
Under the current allocation:
| Rank | State | Electoral Votes |
|---|---|---|
| 1 | California | 54 |
| 2 | Texas | 40 |
| 3 | Florida | 30 |
| 4 | New York | 28 |
| 5 (tie) | Illinois | 19 |
| 5 (tie) | Pennsylvania | 19 |
| 7 | Ohio | 17 |
| 8 (tie) | Georgia | 16 |
| 8 (tie) | North Carolina | 16 |
| 10 | Michigan | 15 |
California, Texas, Florida and New York together account for 152 of the 538 electoral votes. The rankings and totals follow the current National Archives allocation.
Which States Have the Fewest Electoral Votes?
Six states currently have the minimum allocation of three electoral votes:
Alaska, Delaware, North Dakota, South Dakota, Vermont and Wyoming.
Each has one House member plus two senators.
The District of Columbia also has three electoral votes, bringing the number of jurisdictions with exactly three electoral votes to seven. Its allocation comes from the Twenty-third Amendment rather than the state formula.
What Changed After the 2020 Census?
The 2020 Census shifted seven House seats among 13 states. Since a state’s number of electoral votes incorporates its number of House seats, those changes also changed Electoral College allocations.
| State | 2020 Election | 2024/2028 | Change |
|---|---|---|---|
| Texas | 38 | 40 | +2 |
| Colorado | 9 | 10 | +1 |
| Florida | 29 | 30 | +1 |
| Montana | 3 | 4 | +1 |
| North Carolina | 15 | 16 | +1 |
| Oregon | 7 | 8 | +1 |
| California | 55 | 54 | −1 |
| Illinois | 20 | 19 | −1 |
| Michigan | 16 | 15 | −1 |
| New York | 29 | 28 | −1 |
| Ohio | 18 | 17 | −1 |
| Pennsylvania | 20 | 19 | −1 |
| West Virginia | 5 | 4 | −1 |
Texas gained two House seats. Colorado, Florida, Montana, North Carolina and Oregon each gained one. California, Illinois, Michigan, New York, Ohio, Pennsylvania and West Virginia each lost one.
The gains total seven and the losses total seven, so the national Electoral College remained at 538.
The current allocation is the one used for the 2024 and 2028 presidential elections.
Why Maine and Nebraska Are Different
Most states use a statewide winner-take-all system for appointing presidential electors.
Maine and Nebraska use a congressional-district method instead. One elector is associated with the winner in each congressional district, while two at-large electors are associated with the statewide winner.
Maine
Maine has four electoral votes: one associated with each of its two congressional districts and two at large.
Maine law uses ranked-choice counting to determine the relevant presidential results. Its presidential electors at large cast their ballots according to the statewide result, while the district electors follow the result in their respective congressional districts.
Nebraska
Nebraska has five electoral votes: one associated with each of its three congressional districts and two at large.
Nebraska law provides for presidential electors and requires the district electors and at-large electors to act according to the applicable district and statewide results.
Because results are considered separately by district, Maine and Nebraska can divide their electoral votes between presidential tickets.
That happened in both states in 2024. Maine’s four presidential electoral votes divided 3–1, while Nebraska’s five divided 4–1.
When Will the Electoral Vote Map Change Again?
The current allocation applies to the 2024 and 2028 elections.
The next regular reapportionment will follow the 2030 Census. Under the normal decennial reapportionment cycle, the resulting congressional allocation would then be reflected in the presidential election following implementation of that reapportionment.
Which states gain or lose seats cannot be determined from the current allocation; that will depend on the next census and the resulting apportionment.
Redrawing congressional district boundaries within a state does not by itself change how many electoral votes that state has. The total depends on the state’s congressional representation, not the geographic shape of its districts.
Key Takeaways
- The Electoral College currently has 538 electoral votes, with 270 normally required for a majority.
- A state’s electoral votes equal its number of House members plus its two senators.
- The District of Columbia receives three electoral votes under the Twenty-third Amendment.
- The current allocation is based on the 2020 Census and applies to the 2024 and 2028 presidential elections.
- California has the largest allocation at 54, followed by Texas at 40, Florida at 30 and New York at 28.
- Six states have three electoral votes; D.C. also has three.
- The 2020 Census shifted seven House seats among 13 states, changing their Electoral College allocations.
- Maine and Nebraska use congressional-district methods rather than the statewide winner-take-all method used elsewhere.
For the historical results produced by changing Electoral College allocations over time, see U.S. Presidential Election Results: Every Election, 1788–2024.
Sources
Use these as the reader-facing source list:
- National Archives — Distribution of Electoral Votes
- U.S. Census Bureau — 2020 Census Apportionment Results
- U.S. Census Bureau — 2020 Census Apportionment Changes
- National Archives — 2024 Electoral College Results
- Maine Revised Statutes — Presidential Electors
- Nebraska Revised Statutes — Presidential Electors
Election-related information last reviewed September 2026. The American Elections is an independent educational resource and is not affiliated with any campaign, political party, or election authority.